GraphicMeasurer - An image and video analysis framework with an object-oriented spread sheet language

GraphicMeasurer is a program that is able to analyze graphics and videos by locating and tracking objects (e.g. moving animals). The results are stored in geometric objects, which can be referenced using a spread-sheet-like result sheet language that allows to generate tables containing positions, angles or more complex data derived from the located objects.
The application was created by Ben Stöver at the group of Prof. Bleckmann (Institute for Zoology, University of Bonn) within the DFG priority program 1207 "Nature Inspired Fluid Mechanics". (See here for DFG GEPRIS entry.)
Project status and availability
Although GraphicMeasurer is and has been used several by working groups for different projects (see below), it is
still in a developmental state and not publicly available, although it can be provided upon request. It will be
released under GNU GPL in the future, but is currently not under active development. If you are interested in using
GraphicMeasurer or want to take part in its future development, please send an e-mail to
stoever bioinfweb.info.
Applications of GraphicMeasurer
Although GraphicMeasurer has been developed mainly for tracking fish in a flow channel, its design makes it generally applicable to many different (biological) graphic or video analysis problems. Some examples of previous applications of GraphicMeasurer are listed here, but many more (inside and outside biology) are conceivable.
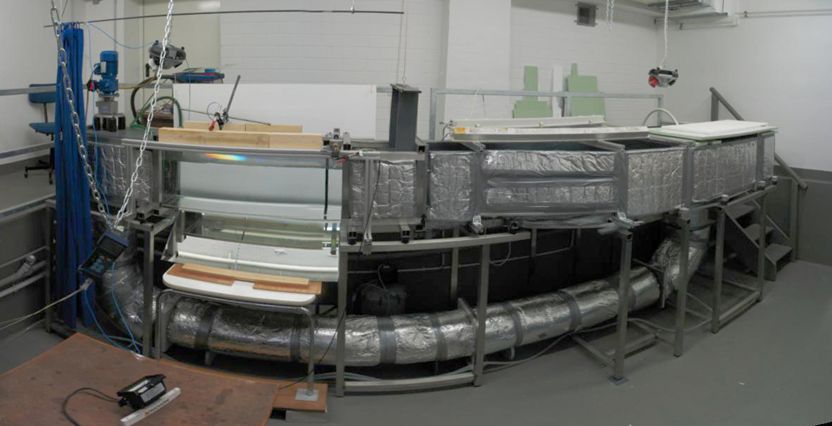
Tracking of fish locomotion in a flow channel
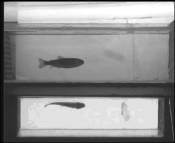
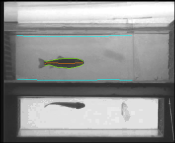
The main application of GraphicMeasurer in the priority program is reconstructing the position and body shape of fishes swimming in a flow channel (fig. 2). It allows to recognize and the track the whole body shape of the fish (or other swimming animals or objects) in three dimensional space (fig. 1). This way reactions of the fish to the flow and pressure conditions (curvature, fin flapping frequency, position, speed, ...) can be quantified.
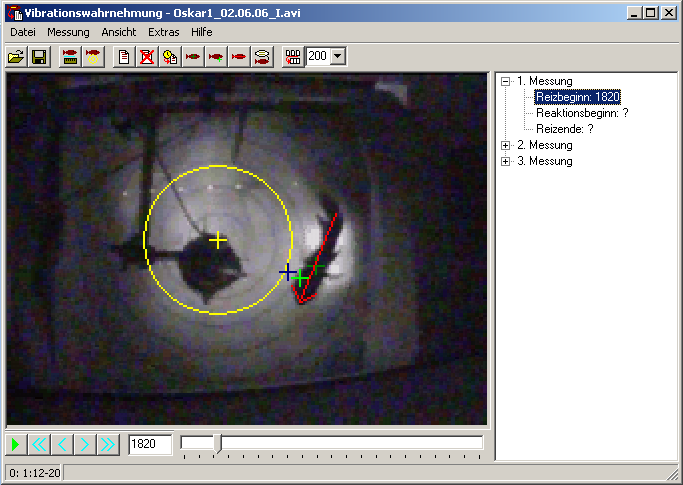
Locating animals in behavioural experiments
At lot of experimental settings in behavioural neuroscience include monitoring the position of an animal in a defined environment in order to measure its reaction to certain stimuli or its preference for certain conditions that differ in this test environment. GraphicMeasurer can be used to both automatically, semiautomatically and manually (e.g. in conditions with very poor image quality, see fig. 3) monitor the behaviour of interest.
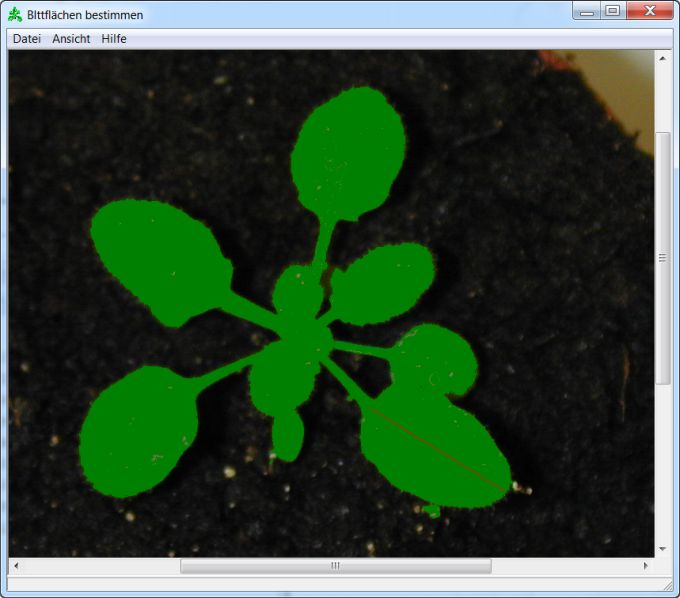
Measuring the leaf size of plants
GraphicMeasurer has been used to automatically measure the overall leaf area of plants that are used in stress tolerance experiments (see fig. 4) at the IMBIO (University of Bonn). Their exact leaf size is needed to normalize e.g. the observed oxygen output.
Generate quantitative morphological characters from fossils
Quantitatively measuring (relative) sizes, lengths or angles is a common task in generating morphological character data from fossils and GraphicMeasurer has already been used in a project at the Steinmann institute for geology, mineralogy and paleontology at the University of Bonn. The concept of generating graphical objects from visual analyses that then can be examined and combined in the result sheet languange makes GraphicMeasurer an ideal tool for such tasks.
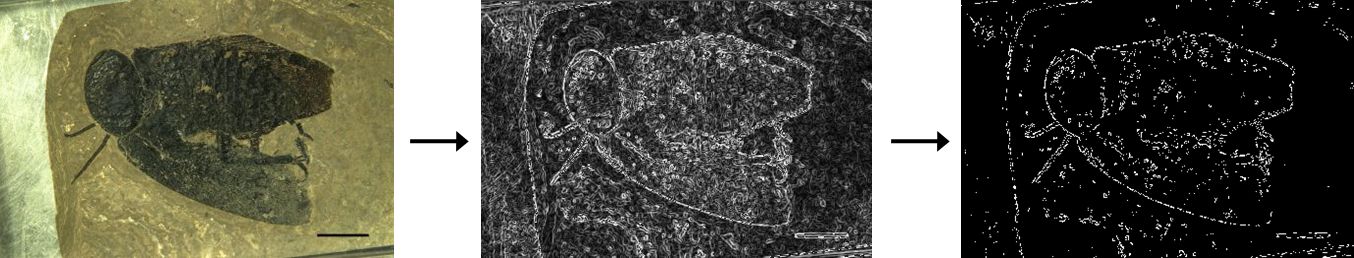
Images provided by Heiko Schmied.
Steps of an analysis
- Image and video files can be opened with GraphicMeasurer. Afterwards graphical objects (like points, curves, polygons, ...) can be added to the image or video frames.
- Besides being drawn by hand the position of the graphical objects can also be determined by analysis routines (which can e.g. recognize the silhouette of a fish and represent it as two horizontal curves).
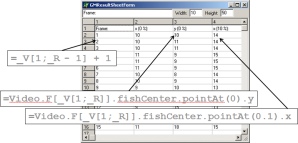
- The resulting data stored in or derived from the graphical objects (e.g. coordinates, distances, angles, ...) can be displayed in a table. In detail, the values and methods of the graphical objects can be referenced with the "result sheet language" that is similar to the language used in spread sheet applications.
 |
→ |  |
→ |  |